Matplotlib:Legend 图例
图例legend基础语法及用法
matplotlib.pyplot.legend(*args, **kwargs)
locLocation code string, or tuple (see below).图例所有figure位置propthe font property字体参数fontsizethe font size (used only if prop is not specified)markerscalethe relative size of legend markers vs. original图例标记与原始标记的相对大小markerfirstIf True (default), marker is to left of the label.如果为True,则图例标记位于图例标签的左侧numpointsthe number of points in the legend for line为线条图图例条目创建的标记点数scatterpointsthe number of points in the legend for scatter plot为散点图图例条目创建的标记点数scatteryoffsetsa list of yoffsets for scatter symbols in legend为散点图图例条目创建的标记的垂直偏移量frameonIf True, draw the legend on a patch (frame).控制是否应在图例周围绘制框架fancyboxIf True, draw the frame with a round fancybox.控制是否应在构成图例背景的FancyBboxPatch周围启用圆边shadowIf True, draw a shadow behind legend.控制是否在图例后面画一个阴影framealphaTransparency of the frame.控制图例框架的 Alpha 透明度edgecolorFrame edgecolor.facecolorFrame facecolor.ncolnumber of columns 设置图例分为n列展示- columnspacing the spacing between columns 列间距
- borderpad the fractional whitespace inside the legend border
图例边框的内边距 labelspacingthe vertical space between the legend entries图例条目之间的垂直间距handlelengththe length of the legend handles图例句柄的长度handleheightthe height of the legend handles图例句柄的高度handletextpadthe pad between the legend handle and text图例句柄和文本之间的间距borderaxespadthe pad between the axes and legend border轴与图例边框之间的距离titlethe legend titlebbox_to_anchorthe bbox that the legend will be anchored.指定图例在轴的位置bbox_transformthe transform for the bbox. transAxes if None.
设置图例位置
使用 loc 参数
plt.legend(loc=‘lower left’)

设置图例字体
设置字体大小
fontsize : int or float or {‘xx-small’, ‘x-small’, ‘small’, ‘medium’, ‘large’, ‘x-large’, ‘xx-large’}
plt.legend(fontsize="xx-large")
设置图例边框及背景
plt.legend(loc='best',frameon=False) #去掉图例边框
plt.legend(loc='best',edgecolor='blue') #设置图例边框颜色
plt.legend(loc='best',facecolor='blue') #设置图例背景颜色,若无边框,参数无效
设置图例标题
plt.legend(loc='best',title='figure 1 legend') #去掉图例边框
案例:设置图例legend到图形边界外
bbox_to_anchor:表示legend的位置,前一个表示左右,后一个表示上下。当使用这个参数时。loc将不再起正常的作用,ncol=3表示图例三列显示。
首先按上面的方式,如果你想将图例放上面就box.height0.8,放右边就box.width0.8其它方式一样。
#主要是bbox_to_anchor的使用
box = ax1.get_position()
# 调整图的位置  并压缩某一条轴
ax1.set_position([box.x0, box.y0, box.width , box.height* 0.8])
ax1.legend(loc='center', bbox_to_anchor=(0.5, 1.2),ncol=3)
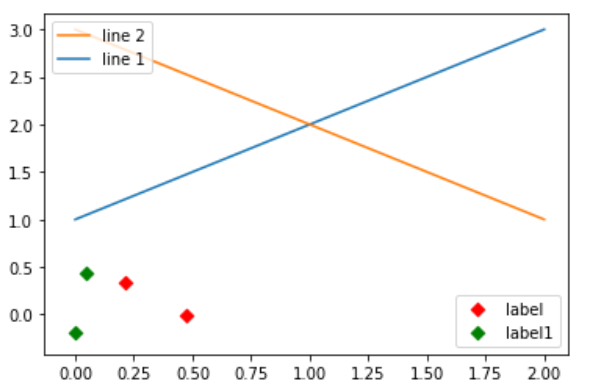
案例:显示多图例 legend
import matplotlib.pyplot as plt
import numpy as np

x = np.random.uniform(-1, 1, 4)
y = np.random.uniform(-1, 1, 4)
p1, = plt.plot([1, 2, 3])
p2, = plt.plot([3, 2, 1])
l1 = plt.legend([p2, p1], ["line 2", "line 1"], loc='upper left')

p3 = plt.scatter(x[0:2], y[0:2], marker='D', color='r')
p4 = plt.scatter(x[2:], y[2:], marker='D', color='g')
# This removes l1 from the axes.
plt.legend([p3, p4], ['label', 'label1'], loc='lower right', scatterpoints=1)
# Add l1 as a separate artist to the axes
plt.gca().add_artist(l1)

plt.show()
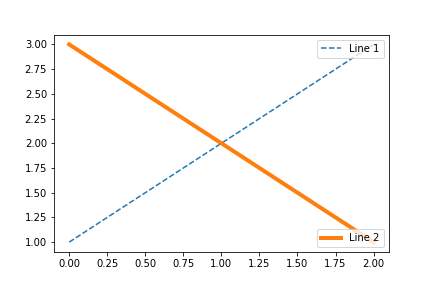
import matplotlib.pyplot as plt
line1, = plt.plot([1,2,3], label="Line 1", linestyle='--')
line2, = plt.plot([3,2,1], label="Line 2", linewidth=4)
# 为第一个线条创建图例
first_legend = plt.legend(handles=[line1], loc=1)
# 手动将图例添加到当前轴域
ax = plt.gca().add_artist(first_legend)
# 为第二个线条创建另一个图例
plt.legend(handles=[line2], loc=4)
plt.show()
import pandas as pd
import numpy as np
import matplotlib.pyplot as plt

fig = plt.figure(1)
ax1 = fig.add_subplot(1,1,1)


df1 = pd.DataFrame(np.random.randn(3,5),columns = ['one','two','three','four','five'])

df1.plot(ax = ax1, title = "df1", grid = 'on')

ax1.legend( loc='lower center',
           ncol=5,bbox_to_anchor=(0.5,-0.15),
            borderaxespad = 0.
            ,fontsize = 8)     ##设置ax1中legend的位置,将其放在图外
plt.savefig('./o1.png',dpi=600)
plt.show()
